Load and explore data
We will be making use of sample data that comes with elasticsearch to explore different features.
Section 1: Login to Kibana dashboard and load data
In this section, you will load data needed for exploration. You will be using Kibana which is a web application that allows you to visualize and analyze data using Elasticsearch as backend.
Get the Kibana URL either from the ‘Output’ section of CloudFormation stack output or from the Amazon Elasticsearch service domain ‘Overview’ tab.
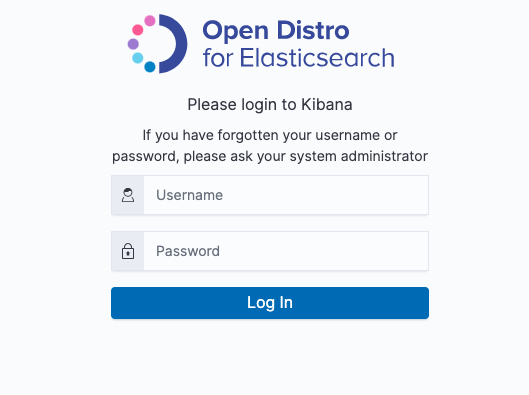
In the below screen, provide the username and password from CloudFormation output

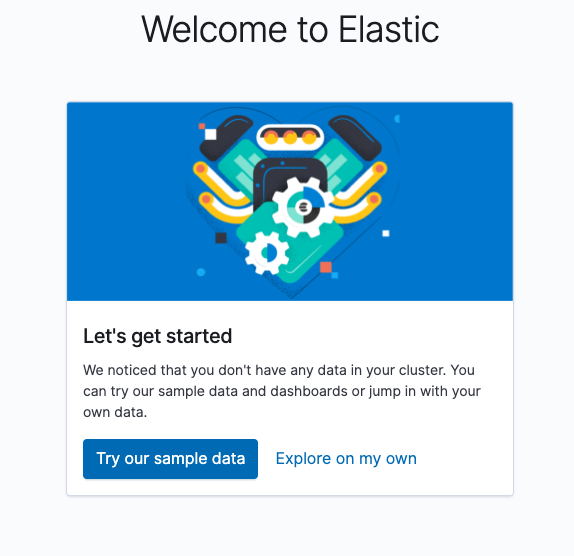
- Once logged in, select the option ‘Try our sample data’

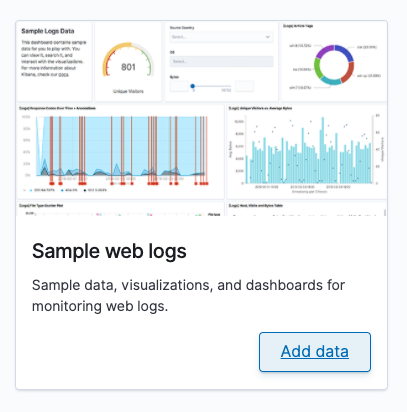
- Select ‘Sample web logs’ from next screen. Once the data load is complete, you will see a message that ‘Sample weblog data installed’

Section 2: Explore the data
In this section, you will explore the data that was loaded in Section 1. You will be using ‘Discover’ which is a tool designed for exploring data in Kibana.
Explore the data by clicking ‘View data’. You shold be seeing a dashboard as mentioned in #4.
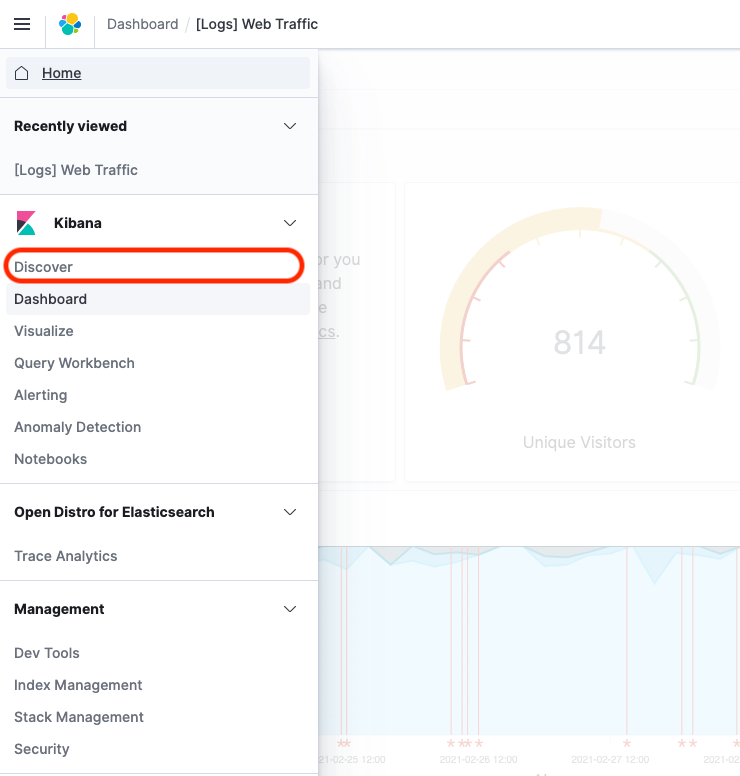
From the burger menu on the left top corner, select ‘Discover’

- In the dropdown, select ‘kibana_sample_data_logs’. You can change the display and search scope by entering different date rages on the calendar option on the top right portion.

- In the ‘Search’ bar, type the below comamnd to search for ‘Successful transactions’
response:200
Type the below command to search for ‘Resourse not found’ errors.
response:404
You can also explore the data by providing various conditions such as:
tags:success
tags:warning
- You can go to ‘Dev Tools’ tab from the burger menu to explore more.
The below query will list all the indices on your domain along with its size.
GET _cat/indices
The below query will helo you to get the number of requests with ‘bytes’ more than 5000.
POST _opendistro/_sql
{
"query": "SELECT count(*) FROM kibana_sample_data_logs where bytes > 5000"
}
- For more information different search quries and capablities, please refer the Open Distro documentation.